See Your eCommerce Store Data in Action with Microsoft Power Bi Advanced Data Visualization
Enhance your eCommerce reporting capabilities with Microsoft Power BI, an industry-leading data visualization and business intelligence tool. Silk Commerce, partnered with leading Open SaaS ecommerce platform BigCommerce, has created Microsoft Power BI example reports that allow merchants to analyze their data and gain insight into store performance.
Looking for Help or Suggestions About Microsoft Power Bi Reporting?
Microsoft Power Bi Example Reports Currently Include
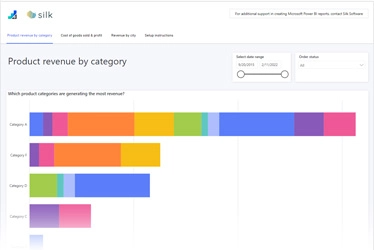
Product Revenue By Category
This report allows you to see product line-item revenue by product category, with the ability to filter by date range and order status.
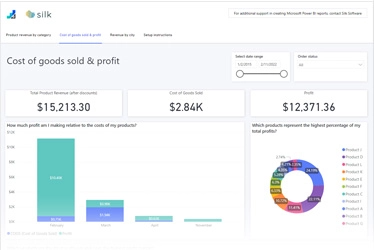
Cost of Goods Sold & Profit
This report allows you to see your product line-item revenue broken down by cost and profit and includes information on your profit margins. It helps you see which products are driving the largest amount of revenue.
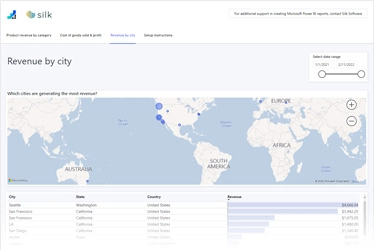
Revenue by City
This report allows you to see which cities across the world your shoppers are purchasing from, based on the billing address they entered during checkout.
Example Reports and Setup Instructions are Available in BigCommerce’s Help Center.
Silk Capabilities


Anchor Link
Let’s Talk Reporting
Looking for help or suggestions about Microsoft Power BI Reporting? Let’s get started.